The Rest of the Story on Tucson’s Home Affordability
A lesson on how a seemingly simple subject is actually quite complex.
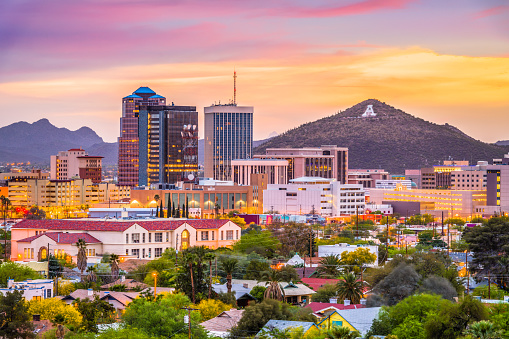
Statistics don’t lie, but they sure can be cherry-picked. Consider this recent headline from the Arizona Daily Star, the daily newspaper in Tucson:
Tucson is still among the best in the West for home affordability
Despite surging home prices, Tucson ranks among the most affordable places to own a home in the West, University of Arizona economists say.
The headline is accurate but misleading. It would’ve been just as accurate if it had said:
Tucson is still among the worst in the West for prosperity
Despite having relatively low home prices, Tucson lags in economic growth, ranks high in poverty and property crime, and ranks low in K-12 test scores.
This commentary is not to slam the Arizona Daily Star for its cherry-picking and hometown cheerleading. In the Star’s defense, home affordability is a much more complicated subject than it would appear at first blush. As such, it’s too complicated to be covered adequately in a short news story.
It’s the same with a lot of complex subjects, especially those where the coverage is influenced by partisan politics or pertains to race, social justice, or income inequality. Sometimes, half of the facts can be found in the left media and the other half in the right media. Most times, though, each side reports 25% of the facts at most, thus leaving at least 50% of the facts unreported. In those cases, it’s necessary to do further research to get the whole story, including conducting primary research by going to original sources.
To that point, the conventional wisdom holds that homes have become less affordable and homeownership has fallen over the years. There’s some truth in that narrative but also a lot that is left out.
One omission is the fact that houses and the real estate market have changed dramatically over the years. This makes it difficult to compare housing between generations.
First, houses are much larger than they were in previous generations, having more than doubled in size since 1973. Second, family size has shrunk over the years, so that fewer people today are living under the same roof and sharing expenses. Third, houses have features and finishes that didn’t even exist years ago, such as central air-conditioning, dual-pane windows, water softeners, granite countertops, and so on. Fourth, building codes and zoning have become more restrictive, thus driving up the cost of land and houses. Fifth, the federal government and the Federal Reserve have exacerbated booms and busts in real estate with their housing and monetary policies.
Adding to the difficulty in making comparisons over time, there are significant differences in architecture, workmanship, and materials between different parts of the country. A house built on permafrost in Alaska is different from a two-story colonial with a basement in New England, is different from a one-story house in Florida built to withstand hurricanes, is different from a high-rise apartment in New York City, is different from a stucco house on a slab with a tiled roof in my adopted hometown of Tucson. The cost of construction labor also varies widely from region to region.
Of course, household income also varies widely by locale and has a direct bearing on the cost of housing: generally, the higher the income, the more expensive the housing—and the better the schools, the amenities, the cultural attractions, the public safety, the general upkeep of private and public property, and the job opportunities. As such, having a lower cost of housing isn’t necessarily a positive. It can be a sign of poverty and associated problems. Sure enough, Tucson has a poverty rate twice the national average.
The standard financial rule is that no more than 30% of household income should go to housing. Thirty percent of the median household income of $44,365 in the City of Tucson is a much smaller number than 30% of the median household income of $253,605 in Chevy Chase, Maryland. Home prices in the two locales reflect these income differences.
There are exceptions to these general rules, however. One exception is boomtowns, where housing construction lags population growth, which in turn drives up prices and drives down homeownership. Austin, Texas, is a case in point. It has a homeownership rate of 44%, which is well below the City of Tucson’s rate of 62.4% and the national average of 65.4%.
Tucson’s population has grown slightly more than 1% per year for the last few years. Phoenix, which is 100 miles up the interstate, has grown faster and was the fastest-growing city in the U.S. last year. San Antonio, which I’ve written about separately and compared on key demographics to Tucson, was the second fastest-growing city.
I’ve detailed elsewhere how a combination of shortsighted local government, provincialism, and an anti-industry culture has left Tucson behind economically. But the point here is that a city with lower growth will tend to have home prices that are lower than the prices in cities with faster growth.
Homeownership is not only low in boomtowns but also low in older and wealthier cities with dynamic economies and no space for expansion. For example, New York City’s homeownership rate is only 33%. But for the larger metro area of New York/New Jersey, where I lived for 10 years, it climbs to 50.7% and climbs much higher in the distant suburbs. Likewise, the rate in the City of San Francisco is only 37.1% but higher in its distant suburbs.
In general, the older the population, the higher the homeownership. That’s because older people have had a long time to grow their assets and home equity. A case in point is the retirement community of The Villages in Florida, where the homeownership rate is 89.2%.
Some metropolises have the best of all worlds: reasonable housing costs, high homeownership, a vibrant and diversified economy, good schools, and plenty of amenities and services. This might blow your circuits, but my boyhood home of St. Louis is a case in point; or I should say, the metro area of St. Louis is a case in point. You may have heard about the horrors of St. Louis, especially its high crime rate, but that refers to the City of St. Louis, which makes up only 10% of the metro area’s population of 2.8 million people. The homeownership rate is 71.1% for the metro area, the cost of living is about 10% below the national average, and taxes in Missouri are about in the middle in a ranking of the states.
A personal aside about St. Louis housing:
My fraternal grandfather and grandmother were poor and poorly educated emigrants from Italy. After first working as a coal miner in southern Illinois, Grandpa moved the family to St. Louis, where he was a barkeep in a speakeasy during prohibition and in a corner tavern after Prohibition was repealed. In spite of their humble station in life, Grandpa and Grandma could afford to send their three kids (my dad and his two siblings) to parochial schools and to eventually buy a brick two-flat in the Italian section of town.
After their kids grew up and had kids of their own, my grandparents lived in the upstairs unit of the two-flat, a unit that had two bedrooms and one bath. At the same time, my aunt and uncle and their five kids lived on a tile setter’s pay in the downstairs unit, which had one bedroom and one bath. One of my cousins slept upstairs in the spare bedroom, and the other four rolled out mattresses to sleep in the downstairs living room and dining room.
How could Grandpa and Grandma afford a two-flat and parochial tuition on the meager pay of one breadwinner? Three reasons: one, taxes back then were a small fraction of today’s levels; two, their house was very modest and far from being a status symbol or HGTV showcase; and three, they knew how to live frugally, as evidenced by having a vegetable garden in their tiny backyard, not having restaurant meals delivered to their door by Grub Hub, not spending five bucks every morning at Starbucks, and not owning a $50,000 car or truck.
Oh, one additional reason: As was common back then, Grandpa and Grandma stayed married instead of never marrying or marrying and then subsequently divorcing. Whatever one’s views of this anachronism, it is inarguable that it cut down on the number of houses that were needed. Two people could live in the same house and share expenses, household chores, and parental responsibilities.
Close-knit families and communities also enabled person-to-person borrowing for down payments on houses—as is the case for some Asian nationalities today. For example, my dad took out a loan from his uncle for the down payment on the decrepit house that he and my mom bought, a house that was 900 sq. ft. and a fixer-upper that required decades of sweat equity to update, given my dad’s low pay as a tile setter and my mom’s low pay as a clerk. Even with the stifling heat and humidity of St. Louis summers, central air-conditioning wasn’t installed in the house until I was in high school.
Remarkably, even with all of these social and economic changes, the overall homeownership rate in the United States has not fluctuated much over the last century. It has remained, on average, in the 60% to 70% range.
Ownership rates vary by race, with African Americans and certain Latin ethnic groups having lower rates, which brings down the U.S. average. The reasons are varied and worthy of a separate discussion.
Some countries have much higher homeownership rates than the United States; some, much lower rates; and some, similar rates. Examples:
Russia, 89%
Poland, 84.2%
Romania, 95.8%
Singapore, 90.4%
Germany, 50.4%
Switzerland, 41.6%
Hong Kong, 49.8%
North Korea, 0
Sweden, 64.5%
New Zealand, 64.6%
(Source: TradingEconomics.com)
These numbers don’t speak to the quality or size of the homes.
There’s much more to the story of home affordability and ownership, but the foregoing should be enough to give you an idea of the complexity of a seemingly simple subject.