Inflation Ate their Lunch, But Americans Made Heroic Efforts to Spend
Personal Income and Spending under Red-Hot Inflation and Omicron.
Not adjusted for inflation, the personal income of all Americans combined, from all sources – from wages, salaries, interest, dividends, rental income, unemployment compensation, stimulus checks, Social Security benefits, etc. but not including capital gains – was essentially flat (seasonally adjusted) in January from December, fell by 2.1% from the stimulus-inflated January 2021, and rose by 11.5% from January 2020, according to the Bureau of Economic Analysis today.
But, in “real” terms, meaning adjusted for the raging inflation, personal income from all sources fell by 0.5% in January from December, and fell by 7.7% from the stimulus-inflated January 2021 and was up only 3.7% from January 2020. But wait… this was for all consumers combined, and the population has grown.
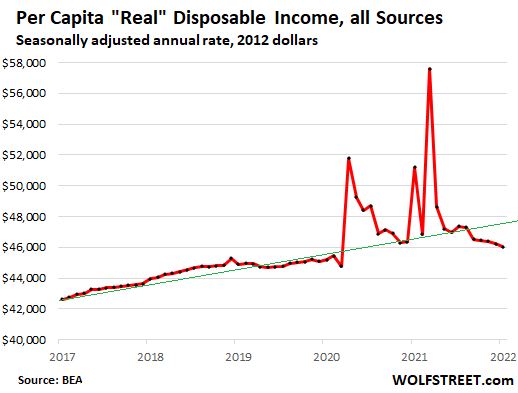
On a per-capita basis — more people divvying up the national pie — and adjusted for inflation, minus personal taxes: The “per-capita real disposable income” fell 0.5% for the month, fell 10.1% from a year ago, and was up only 1.8% from January 2020. In other words, the red-hot inflation over the past six months ate up more than the growth in personal income and further whittled down the purchasing power of labor:
But Americans disposed of their dwindling “real” income heroically.
Not adjusted for inflation, consumers increased their spending by 0.8% in January from December (seasonally adjusted), and by 11.6% year-over-year, blowing money left and right in a heroic effort to keep the economy hopping.
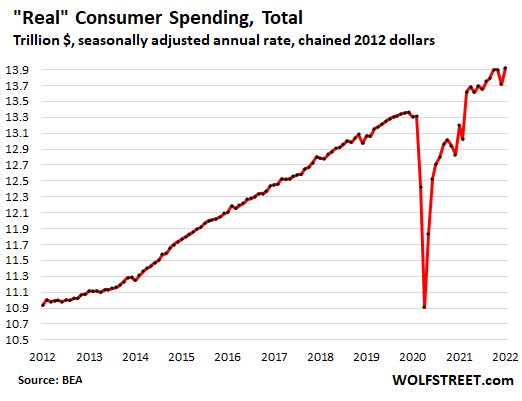
Adjusted for inflation: “real” consumer spending in January, seasonally adjusted, bounced back from the decline in December. The decline in December and the equal bounce-back in January were likely the result of seasonal adjustments in an era when the normal seasonality was upended by the pandemic, which I discussed when it showed up in retail sales too.
Compared to January 2021, consumers increased their “real” spending by 5.4%, and compared to January 2020, by 4.6%, outspending inflation even as it ate up their income increases plus some, and despite Omicron which constrained spending on services over the past three months, as we’ll see in a moment.
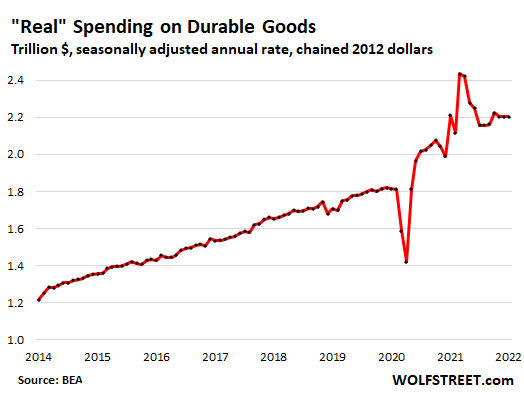
“Real” spending on durable goods – cars, cellphones, appliances, furniture, sporting goods, etc. – was flat in January and down 0.4% from January 2021, but up a whopping 21.3% from January 2020.
During the pandemic, when services such as international travels, concerts, and haircuts were hard to come by, consumers splurged on durable goods, fueled by the moneys they received from the government, and by the moneys they didn’t have to pay for mortgages in forbearance and for rents under eviction bans, and by the moneys they thought they had made in stocks, cryptos, or real estate.
So during the pandemic, there was this historic spike in spending on durable goods, even when adjusted for inflation, which was huge in durable goods (18.4% in January!), and part of the spike from the last round of stimulus checks has now unwound, but durable goods spending even adjusted for inflation remains very high – and this massive historic increase in demand is one of the factors in the shortages that have cropped up everywhere:
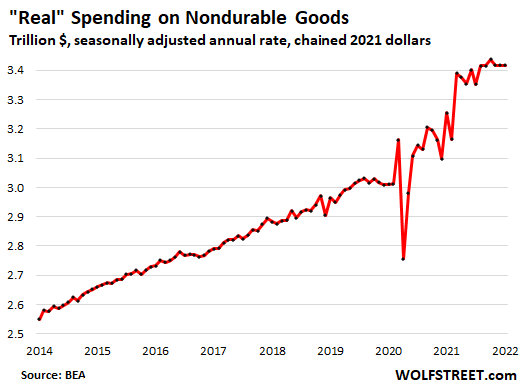
“Real” spending on nondurable goods – mostly food and beverages, all kinds of household supplies, and energy – also spiked during the pandemic, even adjusted for inflation, which was massive for nondurable goods (9.8% in January). Some of the increase during the pandemic has to do with the shift to working at home, when what used to be business spending for food, toilet paper, coffee, and other office supplies shifted to the household and became consumer spending.
In January, real spending on nondurable goods was flat with December but up 5.0% from the stimulus inflated January a year ago, and up 13.5% from two years ago:
*****
Continue reading this article at Wolf Street.