Is 4% the “Magic Number” for Mortgage Rates to Prick the Housing Market (and Stocks)?
The Magic Number in 2018 was around 4.8%. In 2006, it was around 6%. But with today’s super-inflated home prices? Here are the signs.
The average weekly contract interest rate for 30-year fixed-rate mortgages with conforming loan balances rose to 4.06 percent for the week ended February 18, the second week in a row above 4%, and the highest since July 2019, according to the Mortgage Bankers Association today. The average rate for FHA-backed 30-year fixed-rate mortgages increased to 4.09%.
So where is the magic number beyond which this super-inflated housing market starts to feel the pressure of higher mortgage rates?
But mortgage rates remain ridiculously low, in face of CPI inflation that has shot to 7.5% and is still being fueled by the Fed’s ongoing interest rate repression and QE – which makes this the most reckless Fed ever.
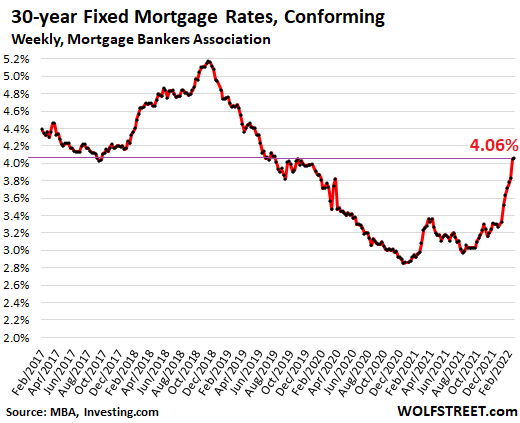
In the fall of 2018, as mortgage rates headed toward 5%, the housing market was beginning to wheeze, and stocks were spiraling down. The magic number at the time appears to have been about 4.8%, and when mortgage rates moved above it in September, all heck started breaking loose.
After the S&P 500 had dropped about 20% by December 24, 2018, and with the housing market weakening, Fed Chair Powell caved under Trump’s daily hammering and did the now infamous U-Turn.
However, back then in early 2019, inflation was below the Fed’s target, as measured by its yardstick “core PCE,” at 1.6%, and that provided Powell a fig leaf.
Now inflation is the worst in 40 years and spiraling higher, and “core PCE” inflation is 2.5 times the Fed’s target. It’s now inflation that is hammering Powell on a daily basis – him who’d made a fool of himself calling this monster he’d unleashed “temporary” when everyone already knew that it would spiral higher.
So where is the magic number this time beyond which the housing market starts to feel the pressure?
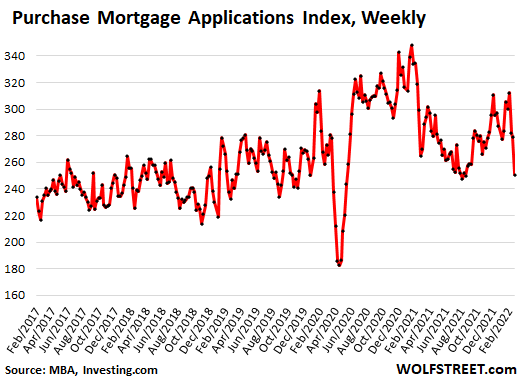
Mortgage applications to purchase a home has dropped sharply for three weeks in a row, coinciding with the surge in mortgage rates, and in the week ended February 18 reached lows briefly kissed in August 2021, and then during the lockdown, to enter the lower part of the range in 2019. The MBA’s index for purchase mortgage applications has now dropped by 28% from the January 2021 pandemic highs (data via Investing.com):
The “Magic Number” in 2006.
Not shown in the chart: Back during the peak of Housing Bubble 1, in January 2005, the MBA’s Purchase Mortgage Index had maxed out at 500 – twice today’s level – before it collapsed.
At that time, the Fed was in the middle of its rate-hike cycle, taking the federal funds rate from 1.0% in June 2004 to ultimately 5.25% by July 2006, which pushed the average 30-year fixed mortgage rate to 6.4%, at which time the housing market ever so slowly began to collapse.
*****
Continue reading this article at Wolf Street.