
Money and Inflation Are Still Related
There is perhaps no empirical regularity among economic phenomena that is based on so much evidence, for so wide a range of circumstances,” Milton Friedman observed in 1989, “as the connection between substantial changes in the quantity of money and in the level of prices.” And yet, despite the wide body of work alluded to by Friedman, most monetary policymakers and economists believe that there is no information to be gained by looking at monetary aggregates. This widespread belief has resulted in governments’ not estimating monetary aggregates, or else estimating them for a much narrower set of series than in prior years. Monetary aggregates make no appearance in many econometric models of the economy, and are rarely if ever brought up in the briefings for Federal Open Market Committee meetings.
This widespread belief that monetary aggregates are uninformative is incorrect.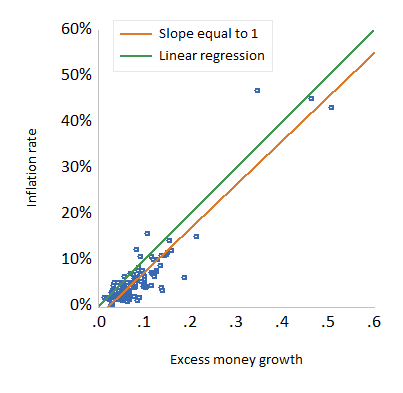
Figure 1. Excess Money Growth and Inflation in 108 countries, 2008-2022.
Figure 1 shows the excess growth rate of money measured by M2 and the inflation rate across 108 countries for 2008 to 2022. M2 is a monetary aggregate that estimates the funds available to buy goods and services. It includes currency, checking accounts, and savings accounts that are close substitutes for currency and checking accounts. The excess growth rate of money is the growth rate of M2, less the growth rate of real income, as measured by GDP. The growth rate of income subtracts the non-inflationary growth of the goods and services available. If the growth rate of money and the growth rate of income were equal, then the inflation rate would be roughly zero. Growth of money in excess of income growth fuels inflation.
The positive relationship between the inflation rate and excess money growth over these 14 years is obvious. A linear relationship with a coefficient of one between inflation and excess money growth is an implication of some theories relating inflation and excess money growth. The correlation of inflation and excess money growth is 0.92. The slope of a line relating inflation and excess money growth is 0.95, when estimated by a regression of inflation on excess money growth.
While not one, 0.95 is not all that far from one. Figure 1 shows a line with the one-for-one relationship and another with the slope of 0.95. They are not all that far apart. Most of the countries in Figure 1 have lower inflation than implied by the excess money growth. This means that the demand for money in these countries increased even more than is implied by the growth rate of real income alone. It does not mean there is no relationship between money growth and inflation.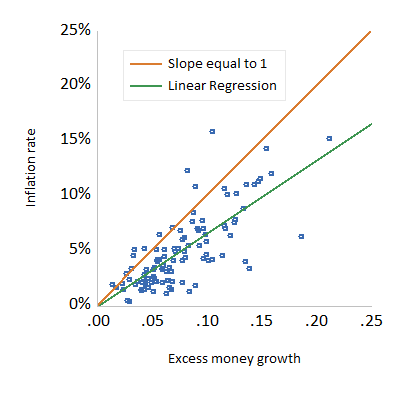
Figure 2. Excess Money Growth and Inflation in Countries with less than 30 Percent Inflation, 2008-2022.
An often remarked aspect of Figure 1 is that the correlation may just reflect the high-inflation countries and the relationship for the low-inflation countries is far less evident. Figure 2 shows the relationship between excess money growth and inflation for countries with average inflation less than 30 percentage points per year. The relation is not as clear, but the correlation between excess money growth and inflation is 0.75. While this correlation of 0.75 is less than a correlation of 0.92 for all the countries, it is hardly trivial.
The slope of the regression line has a larger difference. Comparing the two figures, it is clear that the regression line in Figure 2 deviates from the slope equal to one by more. The slope of the line is 0.85, which is farther from one than 0.95 but also far from zero. And zero is the number implied by an assertion that the information content of monetary aggregates is zero.
The data in Figure 2 are averaged over fourteen years of growth. The fourteen years is the result of data availability. But while the relationship between excess money growth and inflation is evident over longer periods of time, it is not particularly evident for short periods of time. For the data in Figure 1, the correlation of the annual growth rates of excess money and inflation is 0.69, quite a bit less than the 0.95 with the fourteen years of averaged data. For the countries with lower inflation in Figure 2, the correlation is 0.23, again quite a bit lower than the 0.85 with averaged data.
These correlations show two things:
The relationship is weaker for countries with lower inflation than higher inflation; and
The relationship is weaker over shorter time periods.
There is a common explanation for both of these observations. Over shorter periods of time and in countries with relatively low inflation, Mark Fisher and Gerald Dwyer have shown that inflation which is more persistent than money growth can explain both. Inflation is quite persistent as a general rule and money growth less so.
Is the information content of money growth zero? Unequivocally, the answer is no.
Why does this matter?
M2 in 2020 and 2021 increased by the largest percentages in the last 60 years. To the surprise of the Federal Reserve (although not everyone), inflation resulted. Not all countries have increased the money stock to the same extent. Japan and Switzerland have not had outsized increases in the money stock and have not had higher inflation. Monetary policymakers and economists in the United States and some other countries would have done better if they had not ignored money growth.
*****
This article was published by American Institute for Economic Research and is reproduced with permission.

