
INFLATION: Each Worker’s Slice of After-Inflation-Income Pie Is Shrinking.
A look at per-worker personal income, what’s left of it after inflation.
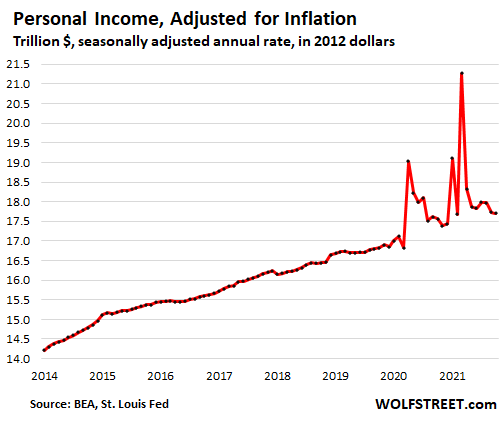
Adjusted for inflation, consumers’ personal income from all sources – from wages, interest, dividends, rental income, unemployment compensation, stimulus checks, Social Security benefits, etc. – so “real” personal income dipped by 0.2% in October from September to a seasonally adjusted annual rate of $17.7 trillion, up by only 0.8% from a year ago, according to the Bureau of Economic Analysis.
Personal income last year and earlier this year gyrated wildly and was grotesquely inflated by the various stimulus payments and special unemployment benefits. Most of the pandemic specials have now expired:
Personal income without stimulus and transfer payments, after inflation – so this is personal income from labor, interest, dividends, rental property, etc. but without transfer payments from the government, such as unemployment benefits, stimulus payments, Social Security benefits, welfare benefits, etc. – was flat for the month, at a seasonally adjusted annual rate of $14.3 trillion.
And it has gone nowhere over the past five months, with all nominal income gains getting eaten up by inflation.
![]()
But wait… More people working, each making less after inflation
This “real” (inflation adjusted) income without transfer payments is a function of two factors:
- Amount earned by each consumer.
- Number of consumers who are earning money.
Real income without transfer payments has been flat for the five months through October. But in October, 2.4 million more people worked than five months earlier.
In other words, the number of workers making money with their labor grew from 151.6 million workers in June to 154.0 million workers in October, and yet all workers combined made the same amount of money adjusted for inflation over those five months. Meaning, on a personal level, on average each worker lost ground to inflation.
For the past five months, inflation, as measured by the BEA, has eaten up any and all income gains from promotions and hiring bonuses and higher wages paid to attract workers, and hire wages to retain workers, etc., plus some.
This chart shows the seasonally adjusted annual rate of “real” income without transfer payments, divided by the number of workers (Bureau of Labor Statistics household survey which I discuss here).
Bringing more people back to work increased overall income before inflation; inflation then ate all the gains in aggregate; and then on a personal level, more workers divided up the same “real” income pie, and each is getting a smaller slice.
*****
Continue reading this article at Wolf Street.