
Social Security COLA Calculations May Get Changed to CPI-E as Part of the Reform Bill. What Does it Mean for Retirees?
Watch out for the costs of housing, medical care, and gasoline.
Social Security benefits are adjusted for inflation – the Cost of Living Adjustments or COLAs – based on the “Consumer Price Index for Urban Wage Earners and Clerical Workers” (CPI-W), released by the Bureau of Labor Statistics. By this measure, inflation was 6.9% in October.
Alas, the COLA for benefits in the year 2022 was based on the third-quarter average CPI-W, when inflation was still lower. And so the COLA for 2022 will only be 5.9%, nevertheless the highest since 1982.
As part of the efforts of reforming Social Security, there are now proposals in Congress – including a Bill by Rep. Al Lawson (D-FL), that include provisions to raise revenues – mostly focused on raising the Social Security contribution cap – and provisions to “improve” benefits, including by switching the COLA calculation from CPI-W to CPI Elderly, or CPI-E.
CPI-E is designed to reflect the purchasing habits of people 62 years and older. The weights of the items in the basket are adjusted to reflect the typical purchasing habits of the elderly.
The biggest factor in the difference is housing costs (“shelter”). It accounts for 36.8% of the weight in CPI-E but only for 32.5% in CPI-W. Housing costs have been soaring in reality, but the CPI has been slow in picking them up. But that has now started, and CPI for housing costs have started to rise and will continue to rise in 2022, and this will accelerate CPI-E more than CPI-W in 2022.
The second-largest factor in the difference is medical care, where the elderly spend a lot more. And there are other major differences where the elderly spend relatively more.
In the other direction, where the elderly spend less, and where weights in the CPI-E are lower than in CPI-W, are gasoline (no more daily commutes, thank god), vehicle purchases, education, and the like.
The table below shows the major categories, accounting for about 73% of total CPI-W and 75% of CPI-E:
| Relative weights | |||
| CPI-E | CPI-W | Points difference |
|
| Shelter | 36.8% | 32.5% | 4.3 |
| Medical care | 12.2% | 8.5% | 3.7 |
| Household furnishings & operations | 5.1% | 4.7% | 0.4 |
| Food at home | 7.4% | 7.7% | -0.3 |
| Apparel | 1.9% | 2.7% | -0.8 |
| Motor fuel | 2.2% | 3.9% | -1.7 |
| New & used vehicles | 5.2% | 7.1% | -1.9 |
| Education & communication services | 4.2% | 6.1% | -1.9 |
The differing weights produce a different inflation reading, and proponents of CPI-E say that it produces a higher inflation reading, which would produce higher COLAs.
But this year, CPI-E is going massively in the wrong direction and the COLA for 2022 would get crushed. The CPI-E for October was 5.7% (red), while the CPI-W was 6.9% (green):
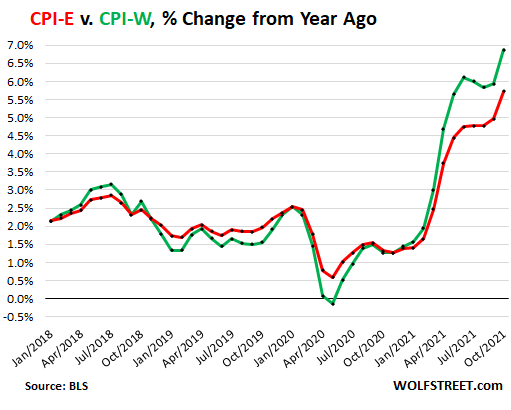
And the COLA under CPI-E for 2022 would be 4.8%, based on the average of CPI-E in Q3, compared to the actual COLA of 5.9%.
COLA calculations would be based on the average CPI-E readings in Q3 of every year. So I calculated COLAs based on CPI-E going back 22 years to 2001 (2000 Q3 CPI-E readings). Over the entire time, COLAs based on CPI-E would have averaged 2.4%, while actual COLAs averaged 2.3%…..
*****
Continue reading this article at Wolf Street.