
The Most Splendid Housing Bubbles in America, Feb 2024 Update: 20-City Index Drops for 2nd Month from Double-Top.
These double-tops are weird. Prices coming off the second top. Only Miami home prices hit a new high.
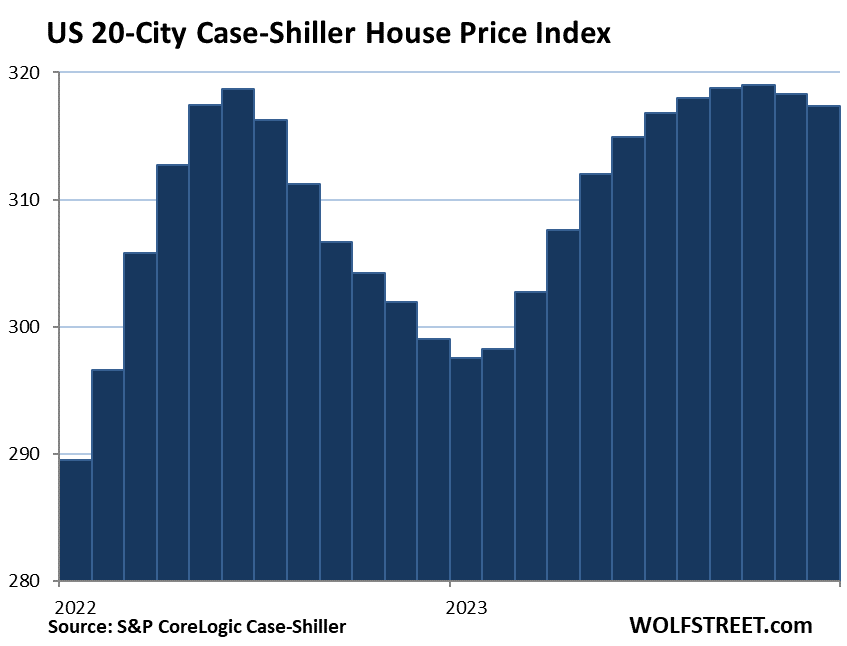
The overall home price index for the 20 metros that today’s S&P CoreLogic Case-Shiller Home Price Index covers declined by 0.6% from the prior month, the second month in a row of declines.
The index formed a double-top with the first peak in June 2022 and the second peak in October 2023. The close-up of the 20-Cities index shows the double-top, and now the beginnings of the downward slope off the second top:
Today’s S&P CoreLogic Case-Shiller Home Price Index for “December” is a three-month moving average of home prices whose sales were entered into public records in October, November, and December. It lags, but it uses the “sales-pairs method,” comparing the sales price of the same house over time, thereby eliminating the issues associated with median prices and average prices (see “Methodology” toward the end of the article).
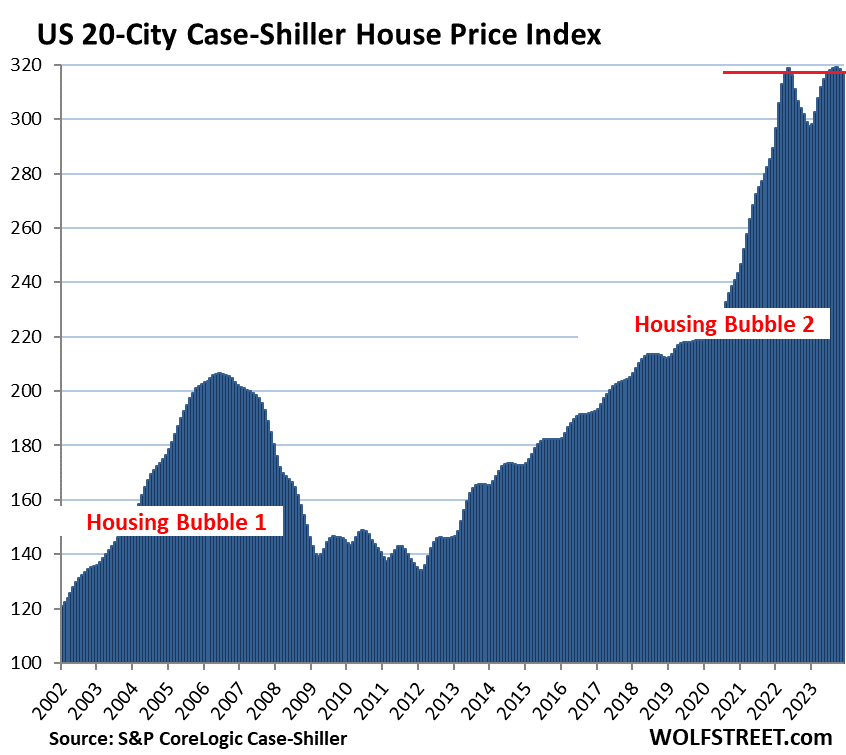
The long view of the 20-Cities Index shows the mind-blowing surge over the past few years: This kind of head-scratcher double-top has never occurred in the history of the index
Prices were below their 2022 peaks in 9 metros of the 20 metros in the Case-Shiller index (% from their respective peak in 2022, month of peak):
- San Francisco Bay Area: -13.4% (May 2022)
- Seattle: -12.5% (May 2022)
- Portland: -7.7% (May 2022)
- Denver: -6.6% (May 2022)
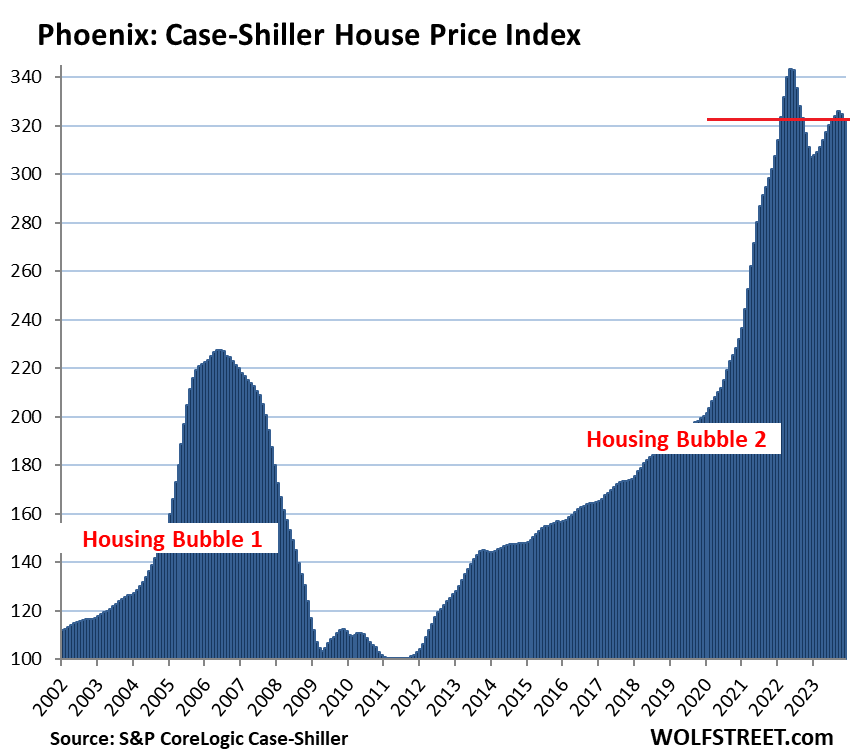
- Phoenix: -6.0% (June 2022)
- Las Vegas: -5.0% (July 2022)
- Dallas: -5.6% (June 2022)
- San Diego: -3.4% (May 2022)
- Los Angeles: -0.4% (May 2022)
Month-to-month declines occurred in 17 of the 20 metros. Only Miami, Los Angeles, and Las Vegas had month-to-month increases. The index for Las Vegas and Los Angeles remained below the 2022 peaks.
Miami was the only metro of the 20 metros to set a new high in December.
*****
Continue reading this article at Wolf Street.